
When the System Runs Short
Europe's scarcity hours are a battery's best hours and the two are the same map

Every year ENTSO-E publishes the European Resource Adequacy Assessment, a vast Monte Carlo model that simulates whether Europe’s power system can keep the lights on under hundreds of weather and plant-outage combinations. Its headline output is a number most people never look at directly: Energy Not Served, the megawatt-hours of demand the model expects the system to be physically unable to meet.
It is, on its face, a reliability metric. A warning. But read it from a battery’s seat and it becomes something else: a map of exactly when, where and in what season flexibility is worth the most. Because the hours the system runs short are the hours prices spike, and the hours prices spike are the hours a battery discharges.
We pulled the hourly ENS projections for 2030 and looked at their shape. Three patterns stand out and all three line up with the arbitrage story.
One: it happens in the evening
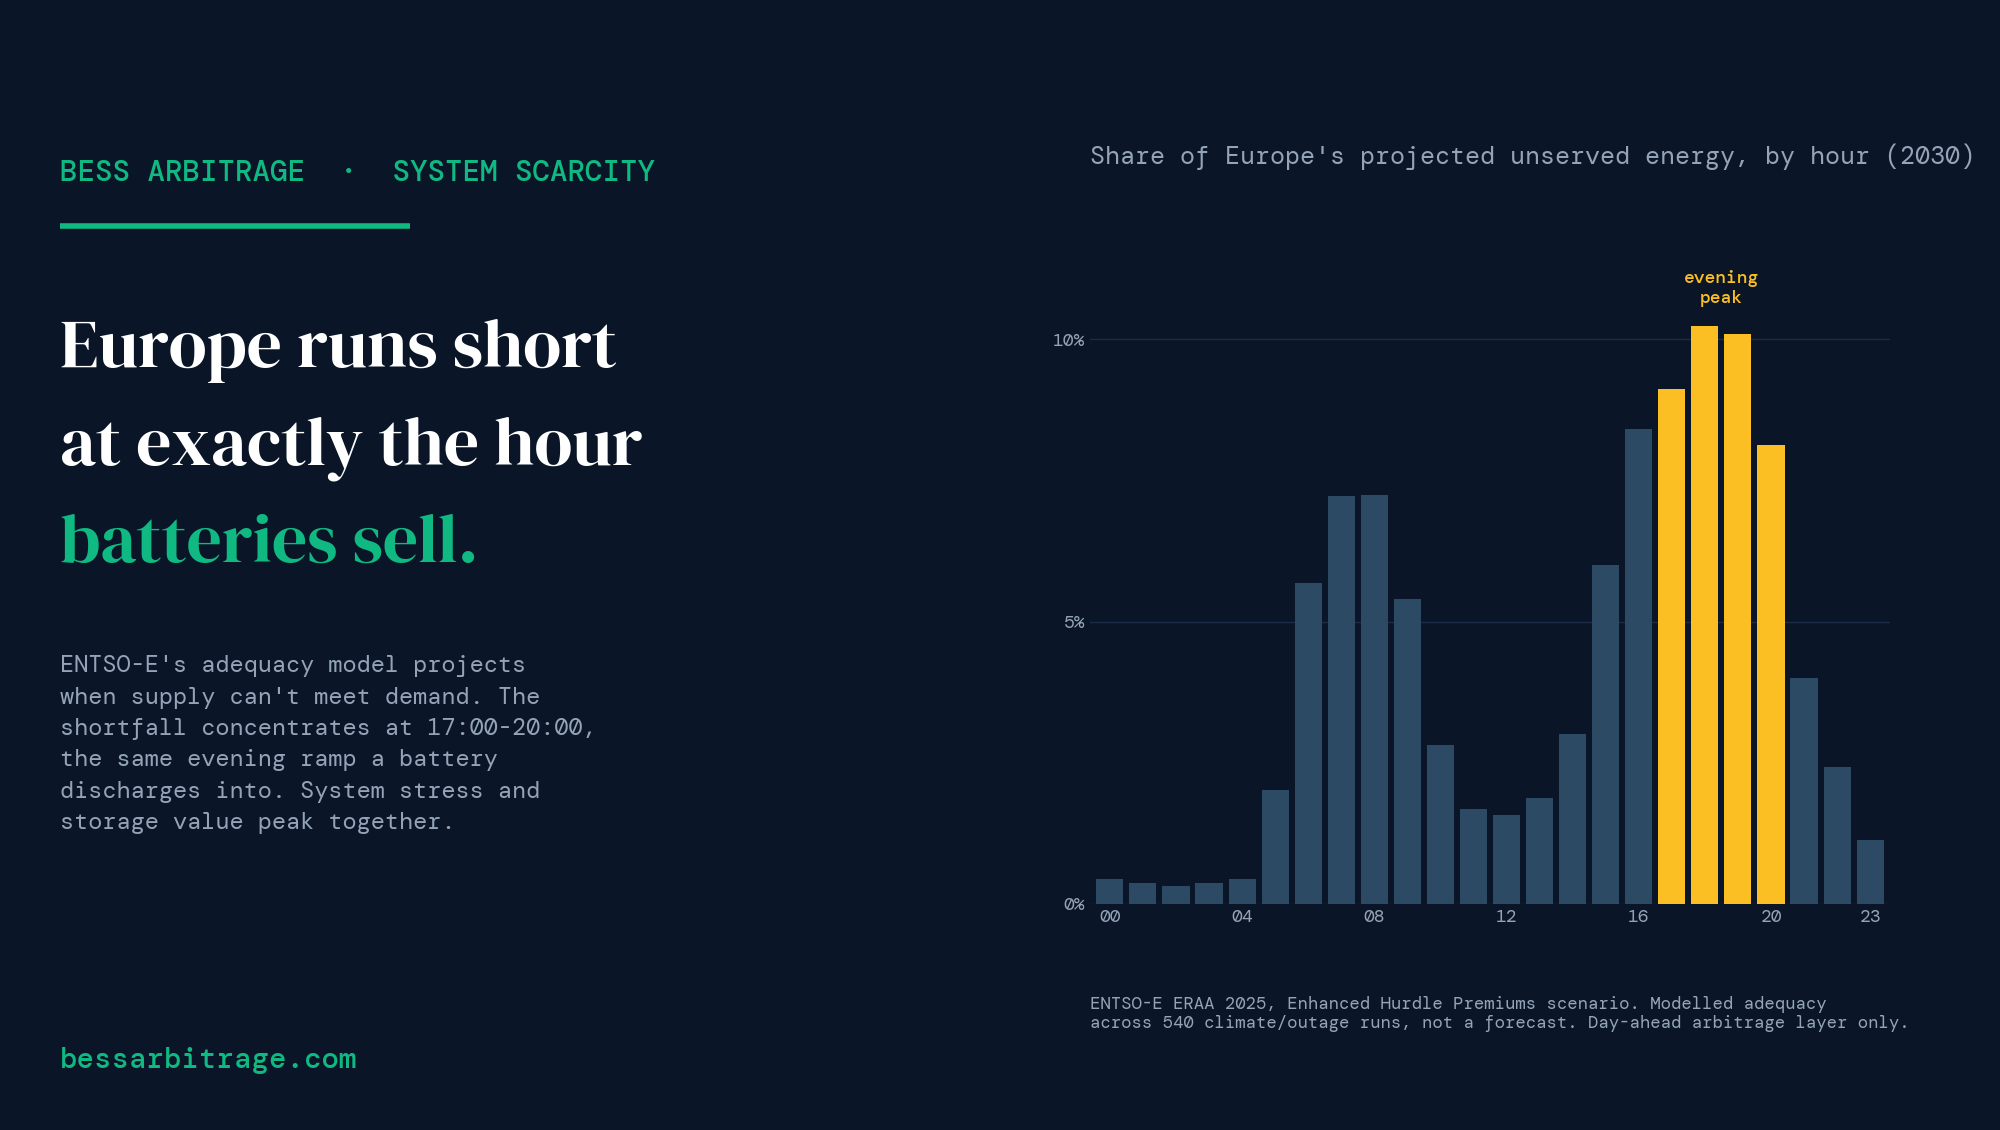
Group every projected hour of shortfall by time of day, and it stacks up in a tight evening block. The peak is 18:00 to 19:00; the window from 17:00 to 20:00 holds the bulk of it.
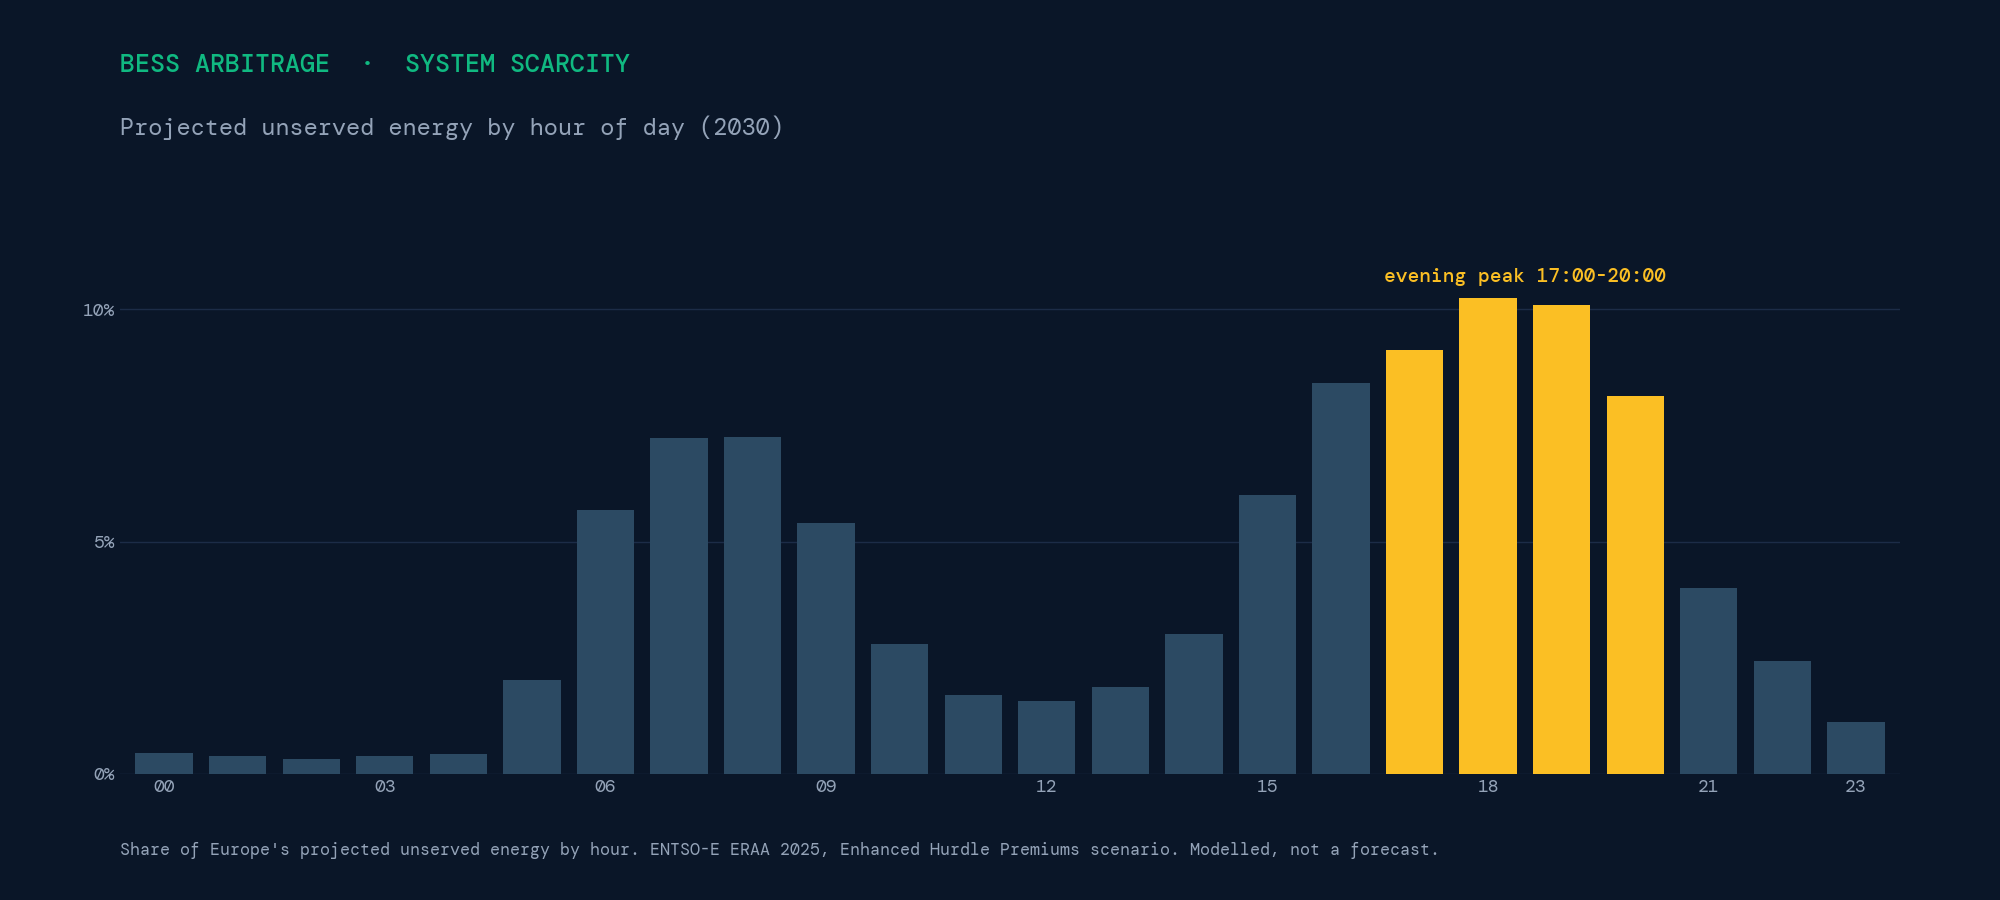
That is not a coincidence, it’s the same physics a battery trades. Solar fades in the late afternoon, demand climbs as people come home, and the system leans on whatever flexible capacity is left. When there isn’t enough, you get scarcity. When there is just barely enough, you get very high prices. Either way, the evening ramp is where the value concentrates, and the evening ramp is precisely the window a battery is built to sell into.
Two: it’s a winter problem, almost entirely
Group the same hours by month, and the seasonality is extreme.
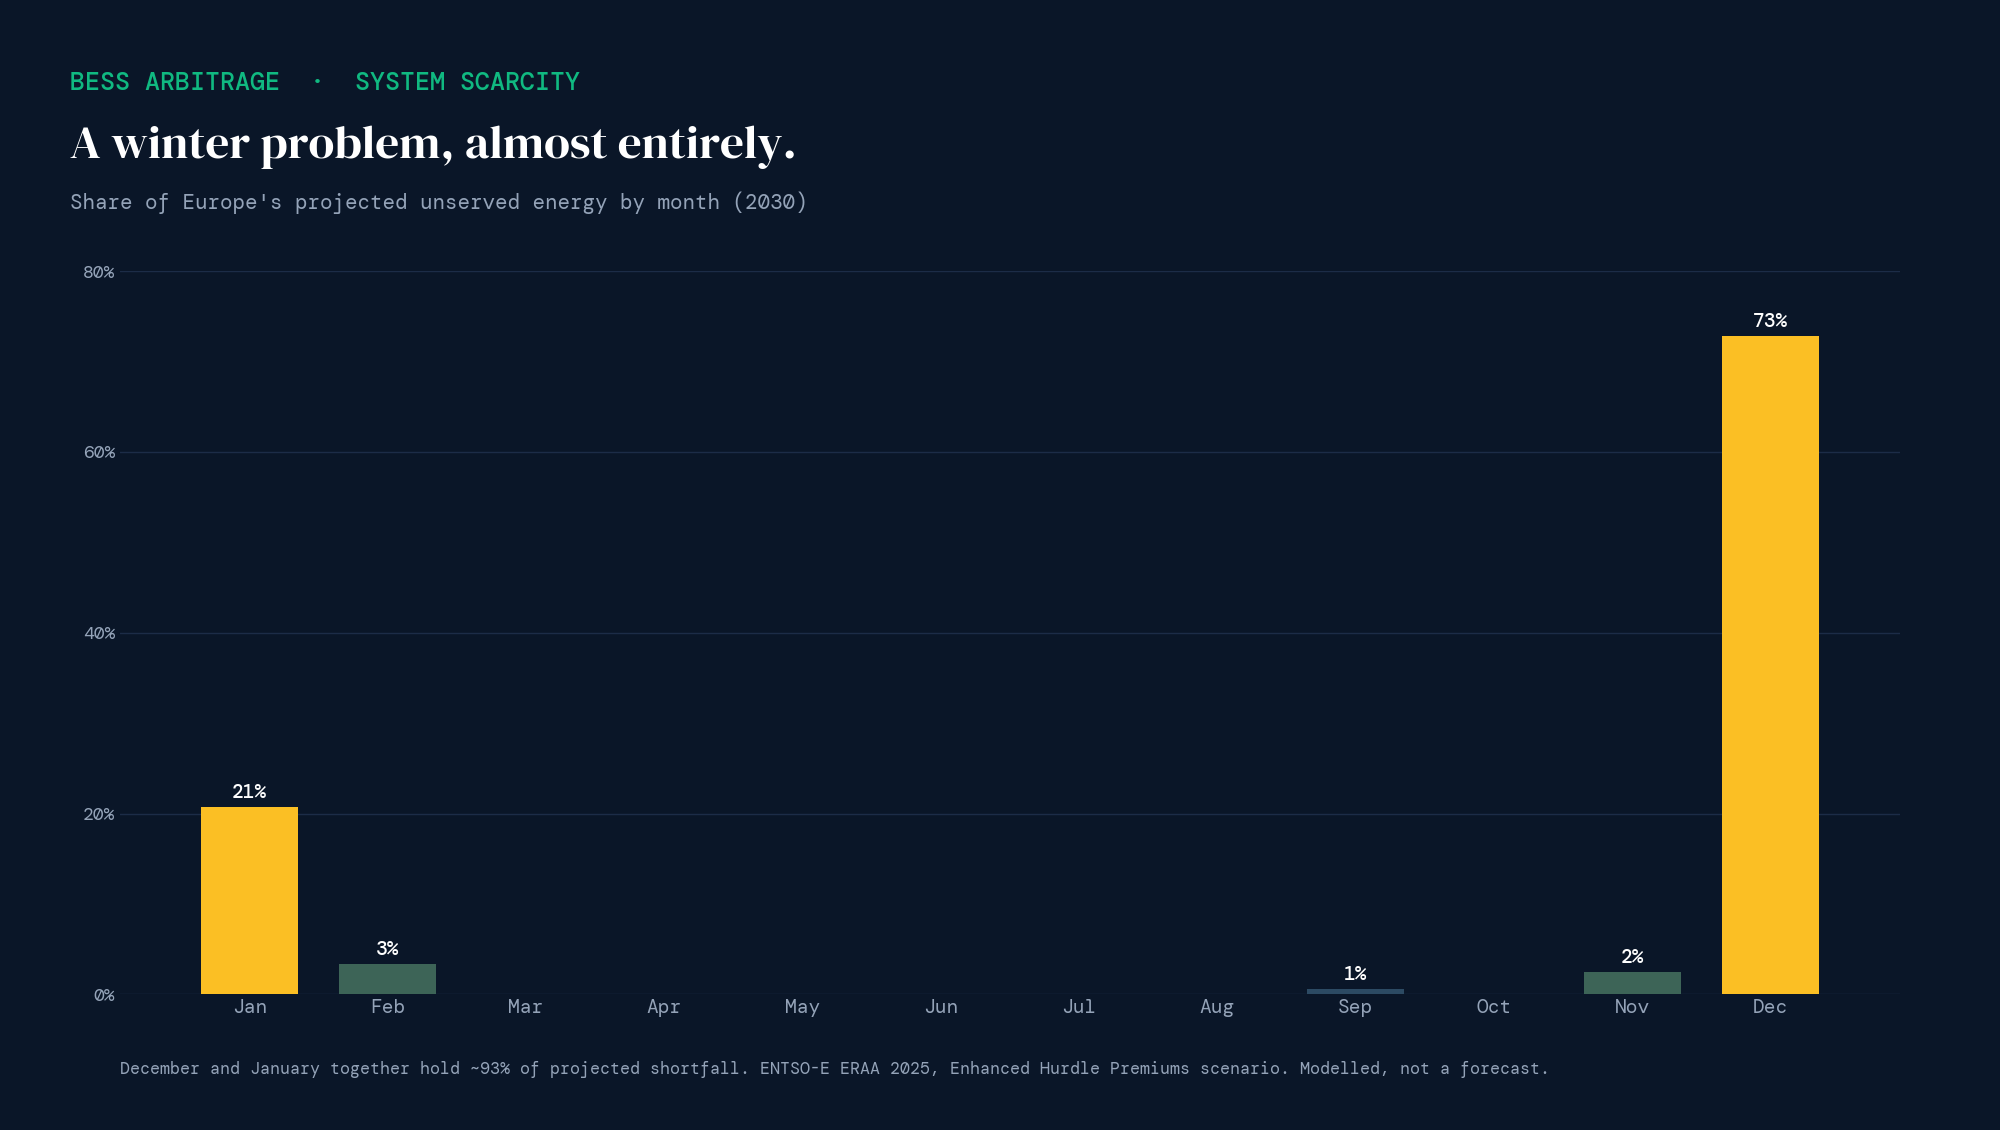
December alone accounts for roughly 73% of the projected shortfall... This is the winter adequacy squeeze: short days collapse solar output, and the tightest hours fall on cold, low-wind spells when renewable supply drops just as heating demand climbs. It’s a supply problem, not a holiday-demand one.
This is worth sitting with, because it splits the battery value story in two. Summer pays through the predictable solar-driven daily cycle, the wide, regular midday-to-evening spread we backtest. Winter pays differently: through rare, sharp scarcity events concentrated in a few December and January evenings, when the system is genuinely tight. A battery earns in both regimes, but for different reasons, and the winter reason is the one this dataset illuminates.
Three: it’s concentrated in Germany
Group by country, and one market dominates.
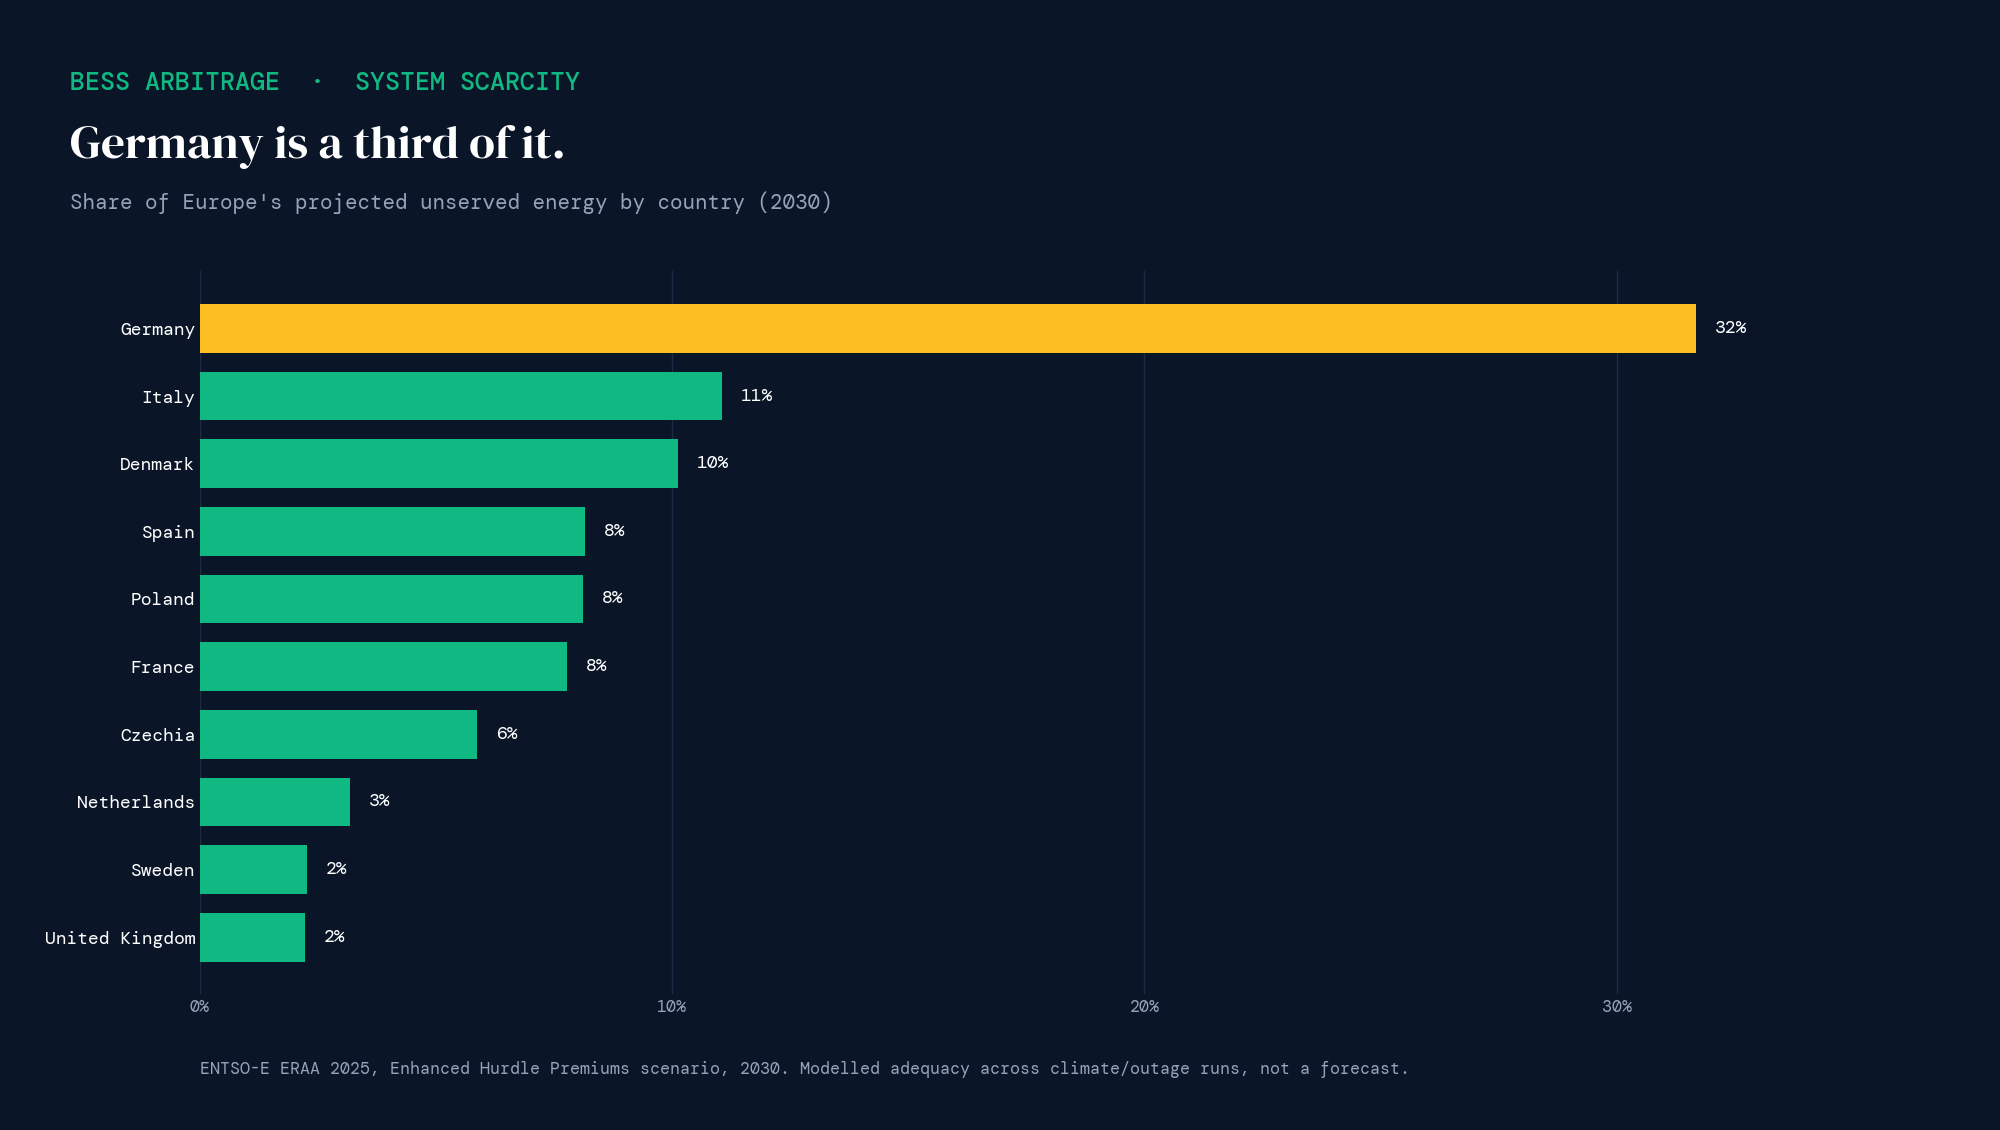
Germany alone is projected to carry about 32% of all of Europe’s unserved energy in 2030, more than Italy, Denmark, Spain and Poland behind it. And on the longer ENTSO-E path the German share keeps climbing, as the nuclear and coal fleet retires faster than firm flexible capacity replaces it.
This closes a loop with something we wrote recently. Germany is also where the largest battery build-out in Europe is planned, tens of gigawatts by 2030. Seen beside the ENS data, that build-out looks less like speculation and more like the system reaching for the flexibility this model says it will be short of. The scarcity and the storage are answers to the same problem.
What this is, and what it isn’t
A few honest limits, because this is a modelled adequacy projection, not a measured outcome or a revenue figure.
It’s a scenario. These numbers come from the ERAA 2025 “Enhanced Hurdle Premiums” run, aggregated across 540 climate-and-outage simulations. A different scenario in the same dataset produces higher totals; the shape, evening, winter, Germany, holds across both, which is what makes the pattern trustworthy even when the absolute level isn’t a single expected value.
High ENS is not the same as high arbitrage revenue. Scarcity signals that prices will be high in those hours, but how much of that reaches the day-ahead spread depends on market design: price caps, capacity mechanisms and scarcity pricing rules all sit between the physical shortfall and the traded spread. ENS tells you where and when the system is tight. It does not hand you a euro figure.
And it covers adequacy, not the whole revenue stack. Our own work measures the day-ahead arbitrage layer, typically 15 to 25% of a battery’s revenue. Scarcity events are also where capacity payments and balancing markets pay out, layers we don’t model. If anything, that means the day-ahead spread understates how valuable these hours are to a fully-contracted battery.
The takeaway
Strip the caveats back and the core observation is simple, and it holds across every cut of the data. Europe’s power system is projected to run short in winter evenings, concentrated in Germany. Those are the same hours, the same season and increasingly the same market where a battery’s arbitrage spread is widest. The reliability problem and the storage opportunity are not two stories. They are one dataset, read from two seats.
We backtest day-ahead arbitrage across European markets and project each market’s spread to 2030: bessarbitrage.com.
Thanks for the insightful article. A few questions:
- Why does Germany have such a high share of EENS? Also compared to the NL, even after adjusting for population.
- Why do countries such as Italy are quite high up as well, contrary to Spain and Portugal where the latter have a lot of solar in contrast with the former. Would one not expect that if solar has a very high share, that EENS might go up? (with the phase out of other energy sources)
- And why is the day-ahead spread of batteries only 15-25% of revenues? What are the other chief components of battery revenues? And their percentages each?
Thanks again!