
European battery arbitrage split in two this spring
From January to May 2026, arbitrage spreads widened across most of Europe and narrowed sharply in the Baltics. The interesting part is not the divergence itself. It is the mechanism behind it.

We have just finished simulating the first five months of 2026. A one megawatt battery, charging in the two cheapest hours of each day and discharging in the two most expensive, run against day-ahead prices from ENTSO-E via Ember for every European market we cover. The point was to see how the arbitrage opportunity is moving this year, while the year is still current.
It is moving in two opposite directions at once.
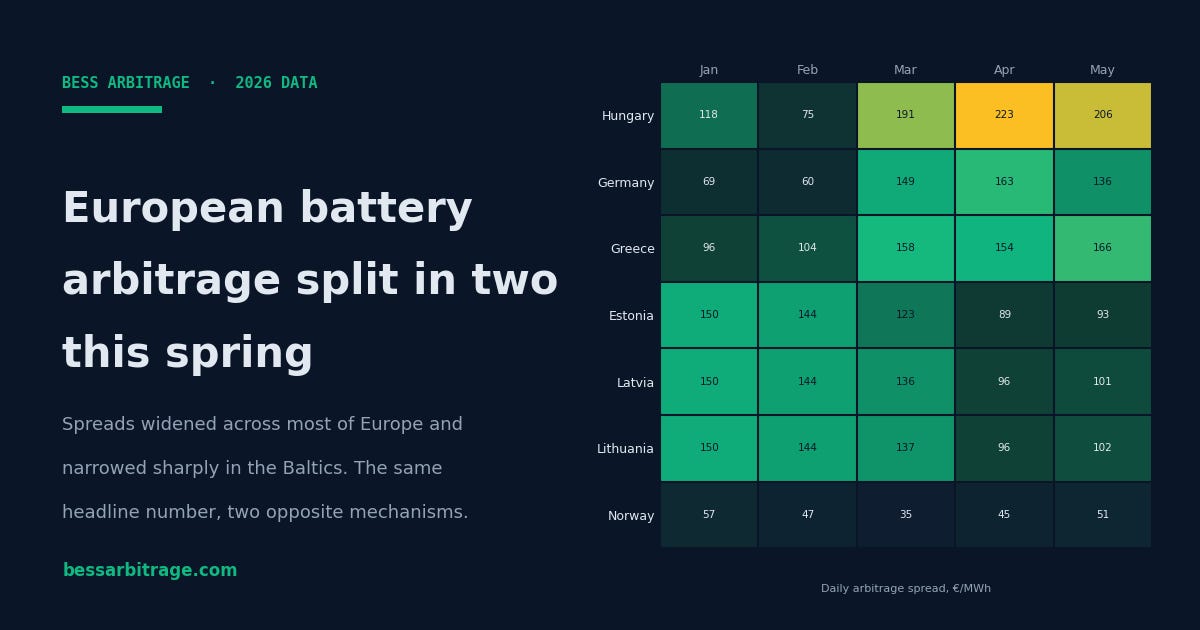
In most of Europe, the daily arbitrage spread climbed steeply from January into April. In the Baltic states, Estonia, Latvia and Lithuania, it did the reverse, falling by a third or more over the same months. Same season, same continent, opposite results.
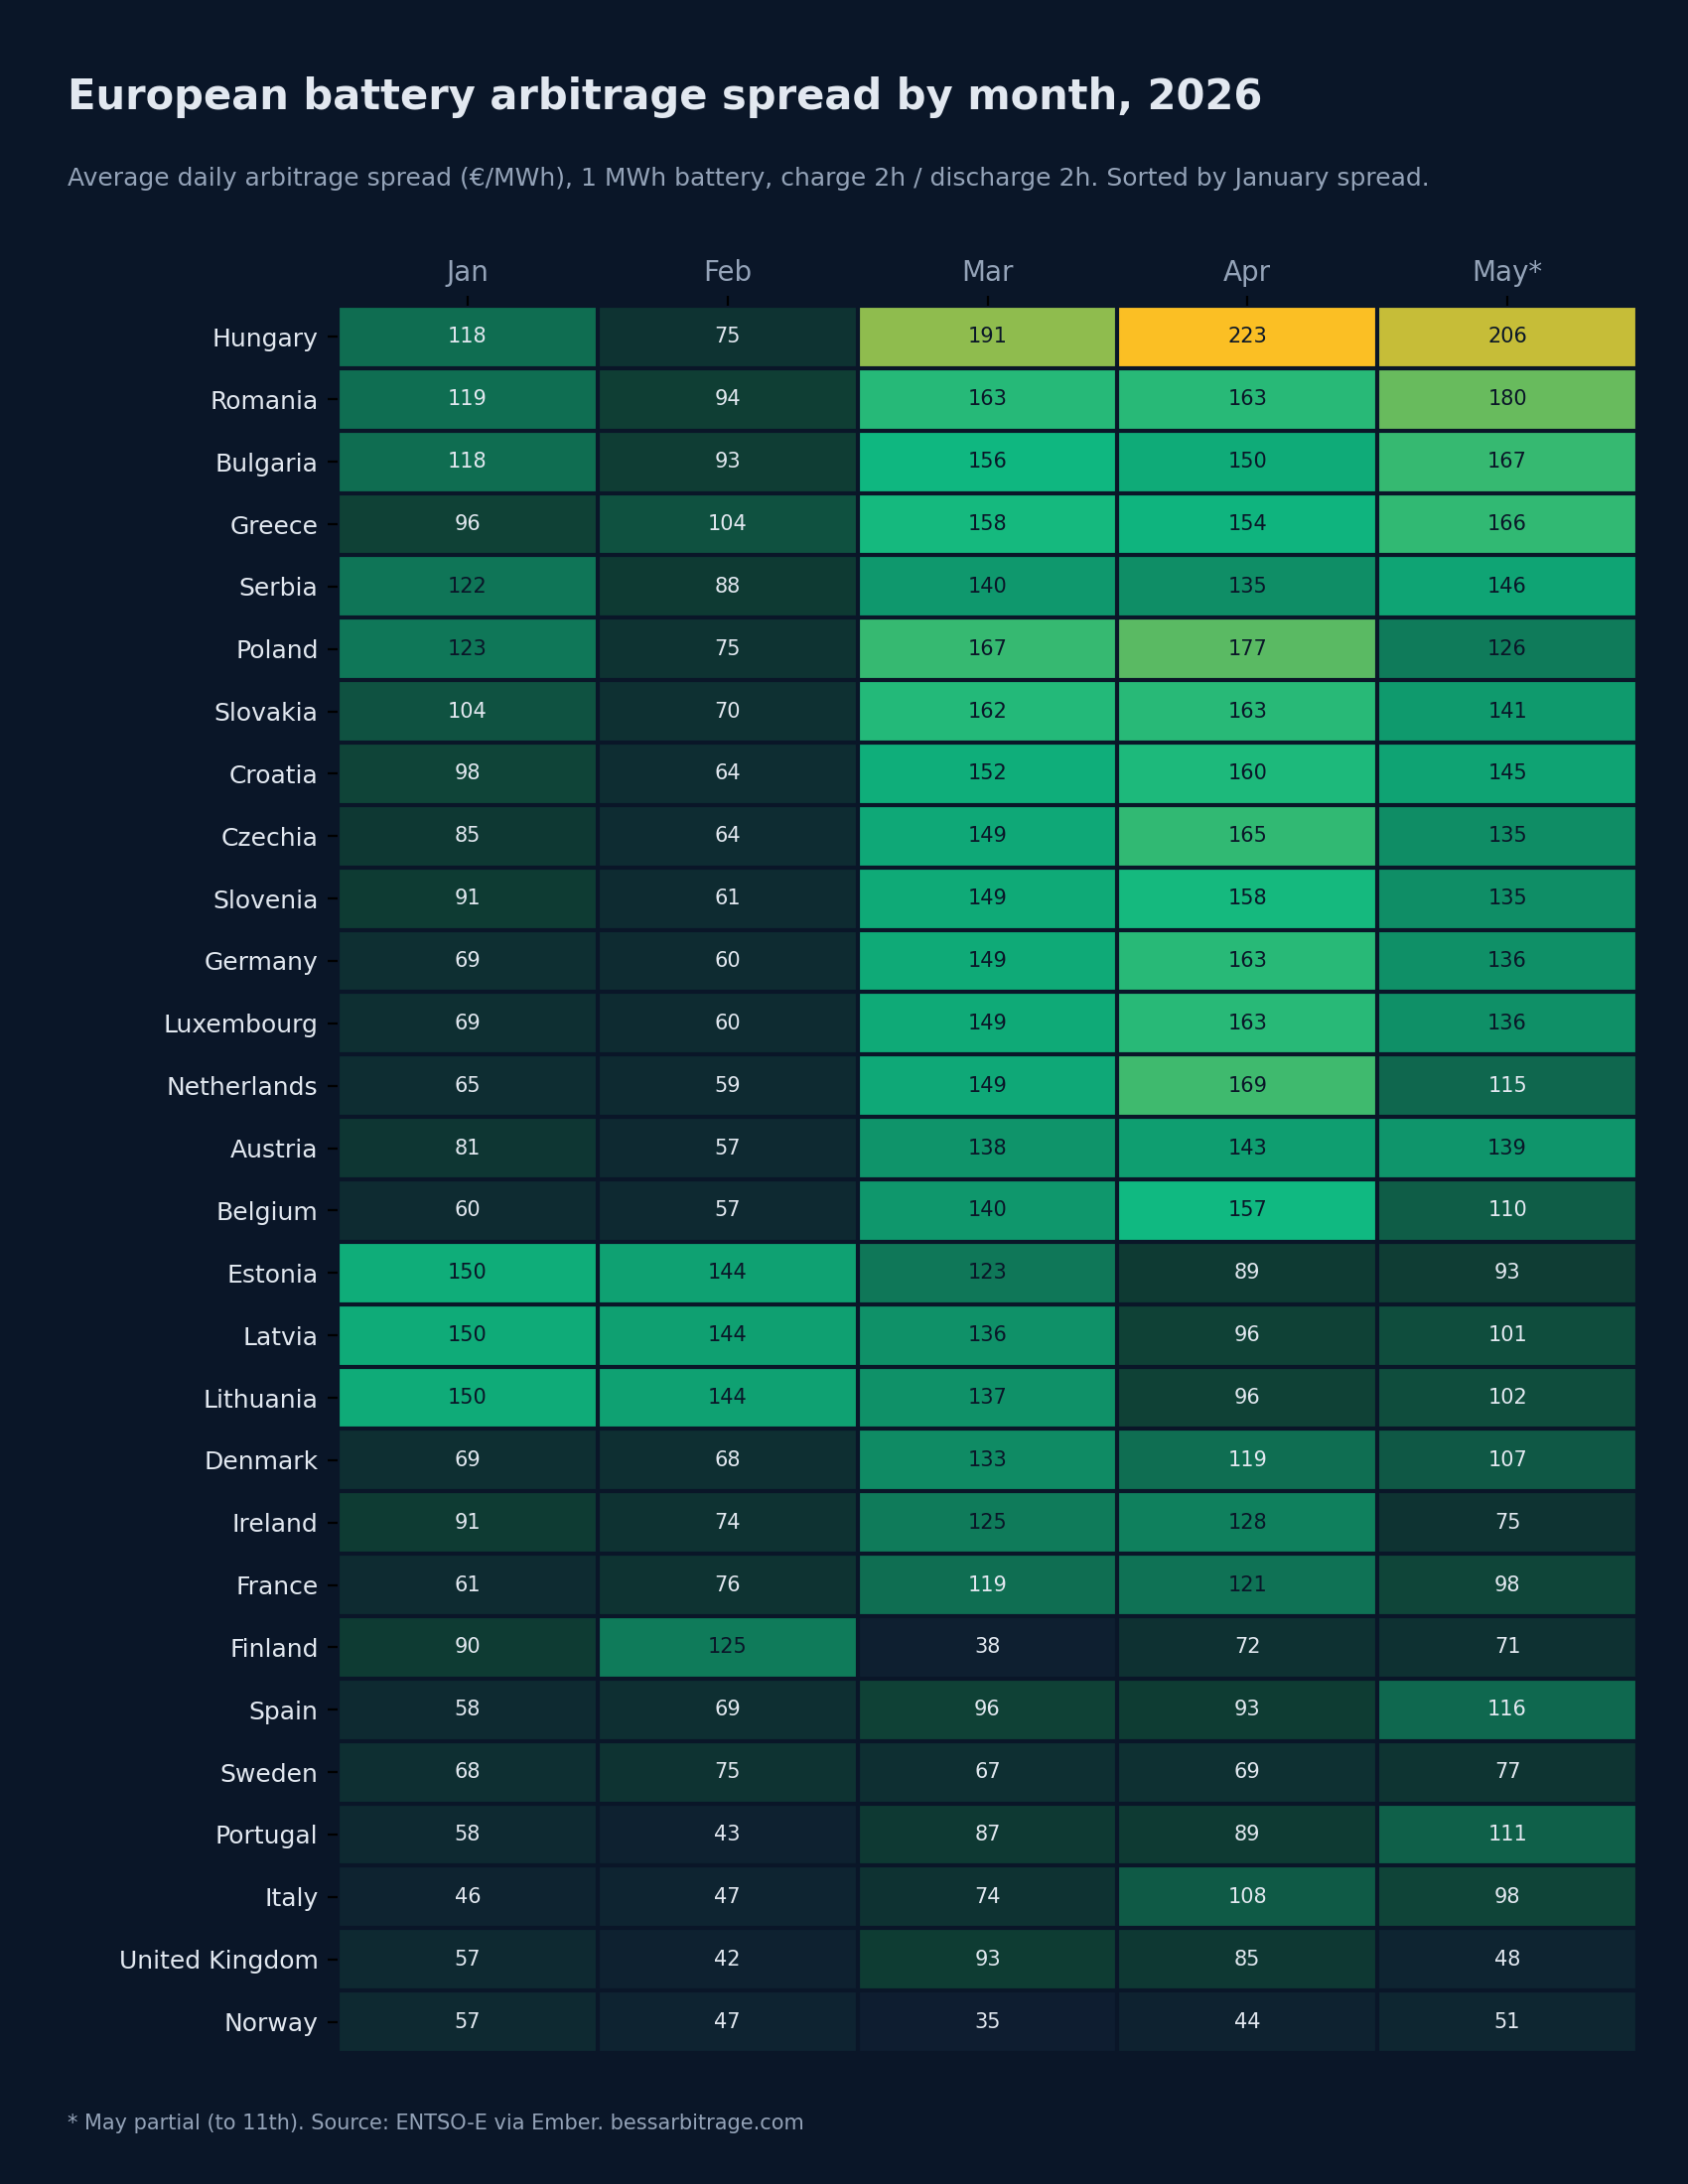
The heatmap makes the split visible at a glance. The Baltic countries are the bright band at the top in January and February. They began the year as Europe’s strongest arbitrage markets. By April and May they have visibly faded, while most of the rest of the continent has brightened. Hungary, Romania, Bulgaria, Germany and others all strengthen through the spring. The Baltics move the other way.
A divergence like that is worth more than a shrug. So we did what the platform is built to do, and split the spread into the two prices that make it up.
A spread is a difference between two numbers
The daily arbitrage spread is not a single quantity. It is the gap between a floor, the cheapest hours of the day, and a ceiling, the most expensive hours. A spread can widen or narrow for two completely different reasons. The floor can move, or the ceiling can move. The headline number does not tell you which. Splitting it does.
When we split the 2026 data, the two halves of Europe turn out to be telling different stories through the same months.
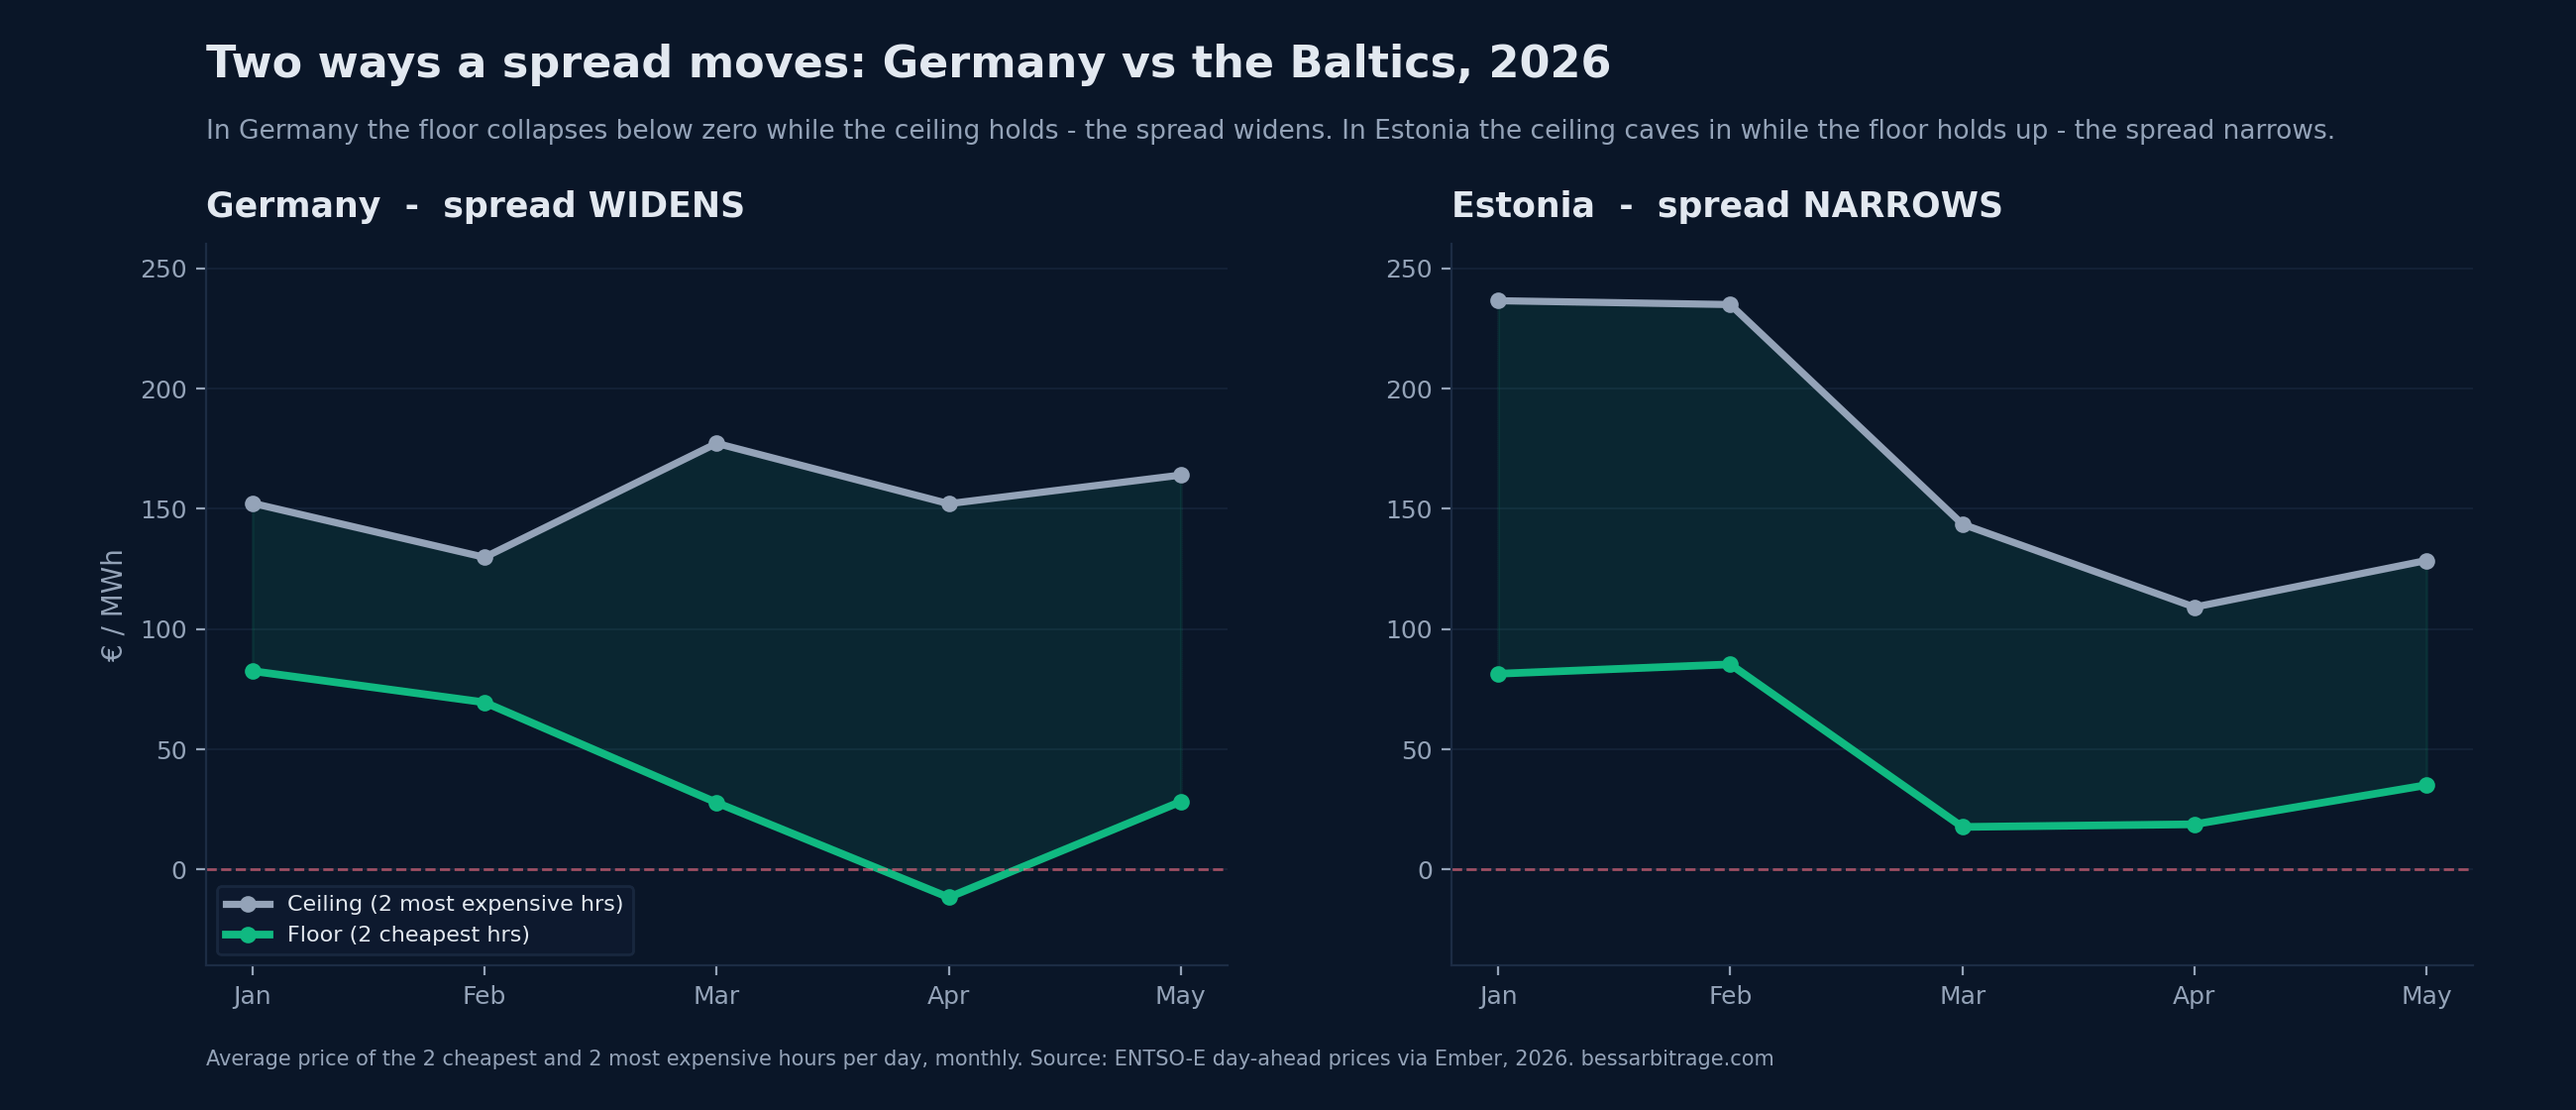
Take Germany first, representative of the markets that strengthened. There, the spread widened because the floor collapsed. The cheapest hours of the day fell from around €80/MWh in January to below zero by April, and Germany recorded over one hundred individual hours of negative prices in April alone. Meanwhile the ceiling, the expensive end of the day, held roughly steady near €150/MWh. The gap a battery earns grew because the bottom fell out of it. This is the solar story: as spring lengthens the days, midday solar generation floods the market and pushes the cheapest hours toward, and through, zero.
In Estonia, representative of the Baltics, the opposite happened. The floor did fall, but only modestly, and it never went deeply negative. Estonia saw a handful of negative hours in April against Germany’s hundred-plus. What moved was the ceiling. The most expensive hours of the day collapsed, from around €235/MWh in the winter months to near €110 by April. The Baltic spread narrowed not because cheap power flooded in, but because the expensive hours went away.
That distinction matters for anyone reading these markets. A spread holding up on a collapsing floor and a spread shrinking because its peaks have faded are different conditions, with different outlooks, even when the headline number moves a similar amount.
What we can say, and what we cannot
We can say with confidence what the Baltic spread did, and through which mechanism. It narrowed, and it narrowed from the ceiling. That is in the data, plainly.
Why the Baltic peak prices fell so far is a harder question, and an honest article should not pretend the price data answers it. The Baltics are a distinctive corner of the European system. They synchronised with the continental grid only recently, they are smaller and more interconnection-dependent than the large western markets, and they have their own mix of hydro, wind and demand. Any of those could be contributing. Spring conditions are part of it. Across the neighbouring Nordic market, energy analytics provider Montel notes that spring snowmelt and mild shoulder-season demand routinely soften prices, as cheap must-run hydro displaces the expensive peaking plants that would otherwise set the evening highs. That mechanism fits a falling ceiling. But attributing the precise size of the Baltic move to a single cause would be guesswork, and we would rather flag it as an open question than dress a guess as a finding. If you have a sharper read on the Baltic market this spring, we would genuinely like to hear it.
Why the split is the point
The broad story of 2026 so far, spreads rising across most of Europe, is real, and it is consistent with what other analysts are seeing. GEM Energy Analytics has noted that day-ahead spreads have been rising since 2023, driven largely by solar growth, and are likely to keep rising through 2026. Our data agrees.
But “spreads are rising” is the comfortable headline, and the comfortable headline hides the Baltics entirely. A battery developer working from a European average would never see that three markets moved hard in the other direction, or that the markets which rose and the market which fell did so through opposite mechanisms. The average is not wrong. It is just not specific enough to make a siting decision on.
That is the practical takeaway. An arbitrage spread is two numbers, not one, and the same headline figure can be built on a collapsing solar floor or a fading scarcity ceiling. Which one a market is depends entirely on the mechanism underneath, and the mechanism is never in the ranking.
What this measures, and what it does not
This is the day-ahead arbitrage layer only, the spread between cheap and expensive hours in the wholesale day-ahead market. It excludes ancillary services, capacity payments, balancing and intraday trading, which together make up the larger share of most batteries’ revenue. It is one layer, measured conservatively.
It is also a backtest, not a forecast. The 2026 figures here cover 1 January to 11 May only, a partial year. Arbitrage has a strong seasonal shape, and several markets are historically strongest later in the year. What the charts show is what the day-ahead market actually did in early 2026, not a projection of what it will do next.
If you want the floor, the ceiling and the spread for a specific market rather than a continental average, that is what our platform produces. The data behind this article is the same data behind those reports.
Day-ahead prices: ENTSO-E, 1 January to 11 May 2026. The arbitrage spread is the daily average gap captured by a 1 MWh battery charging in the 2 cheapest and discharging in the 2 most expensive hours. 2026 is a partial year. bessarbitrage.com